Restaurant Performance Dashboard
New feature for order-processing platform

Background
Food delivery applications have transformed the restaurant experience. Restaurants have the added responsibility of providing the same level of service to customers online as the real-life ones in front of them. However, performance expectations in a delivery app differ from a brick-and-mortar store.
Since restaurants play a significant role in providing a seamless delivery experience, we wanted to investigate how to influence them to improve their performance on the order-processing platform. We designed a feature that helps restaurants understand and track their performance goals.
Framing the problem
Before starting to solve anything I wanted to take a look at the issue at hand and break it down to its root cause(s).
We want to influence restaurants to improve their performance on their order processing application. The underlying problem is that restaurants do not have a clear understanding of how they are performing or what it means to achieve good performance on the app. This is problematic because they are not aware of how to improve, and as a result, their online business and customer reputation are negatively impacted.
What is a "Good Performing Restaurant"?
Through my research, I learned that this had not been clearly defined. Although the business was tracking many different metrics related to performance, it was important to focus on the goals restaurants have the most control over. Together with stakeholders, we defined a model of a Good Performing Restaurant which was comprised of three main areas:
- Order health
- Productivity
- Customer perception

Model of "Good Performing Restaurant"
Solving the problem
Keeping these things in mind, I decided on the following mission statement:
Make model of "Good Performing Restaurant" explicit
Goals
- Clearly define what it means to be a Good Performing Restaurant
- Create a dedicated metrics screen where users can track performance goals
- Highlight insights that users can take immediate action on
Benchmarking
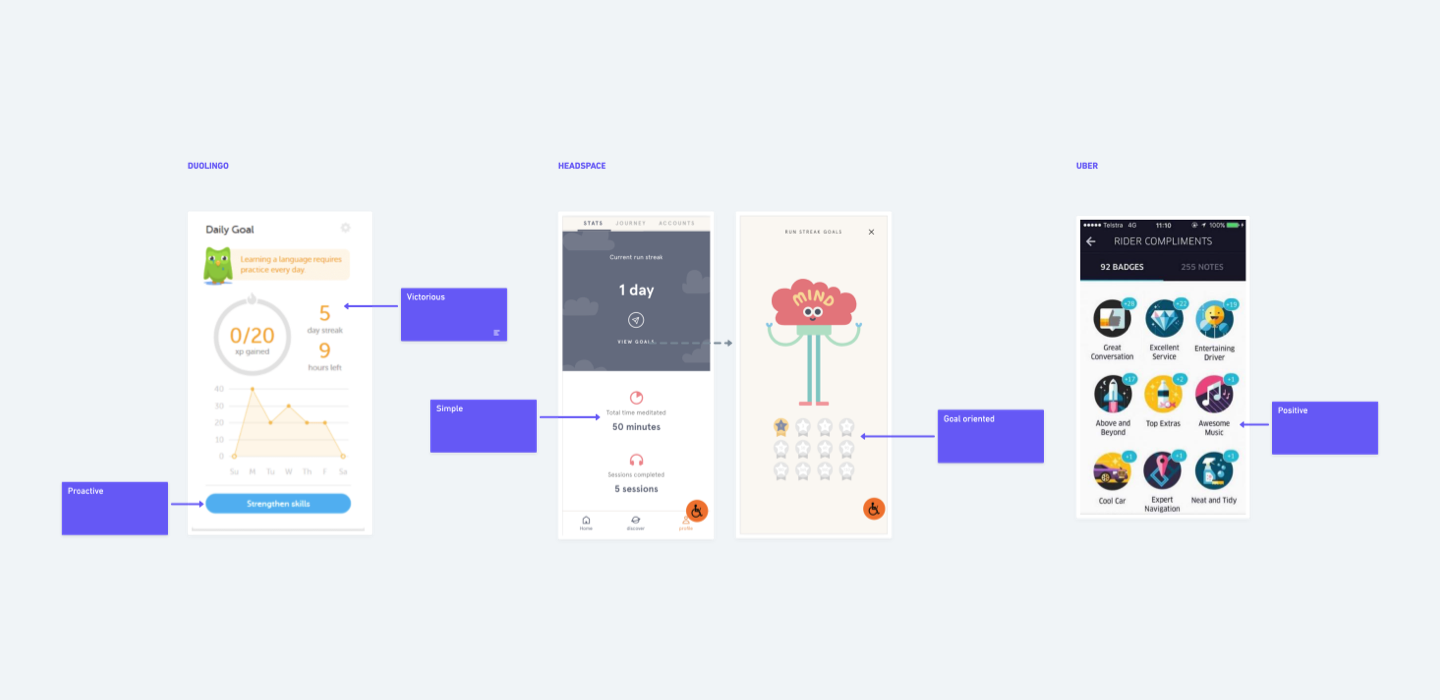
To gain inspiration, I explored many different applications that have performance-related features. I noticed that all content shared the following principles:
- Simple
- Proactive
- Victorious
- Goal-oriented
- Positive

Benchmarking Inspiration from Duolingo, Headspace and Uber
Ideation
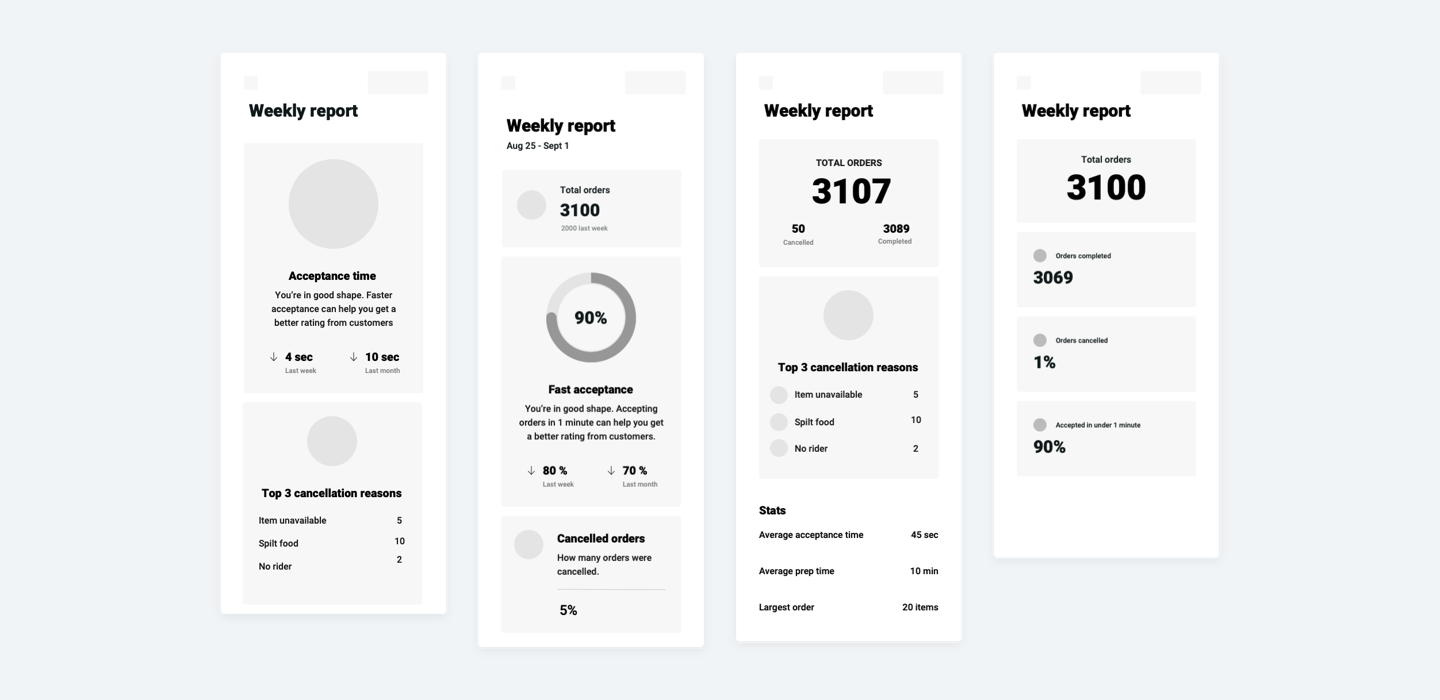
The conceptual direction and requirements were already pretty clear after the phases above, so I could jump straight into exploring preliminary ideas for the performance metrics screen. I tried to put in all the content and explore where to include visualization.

Some initial ideas created during ideation
Testing
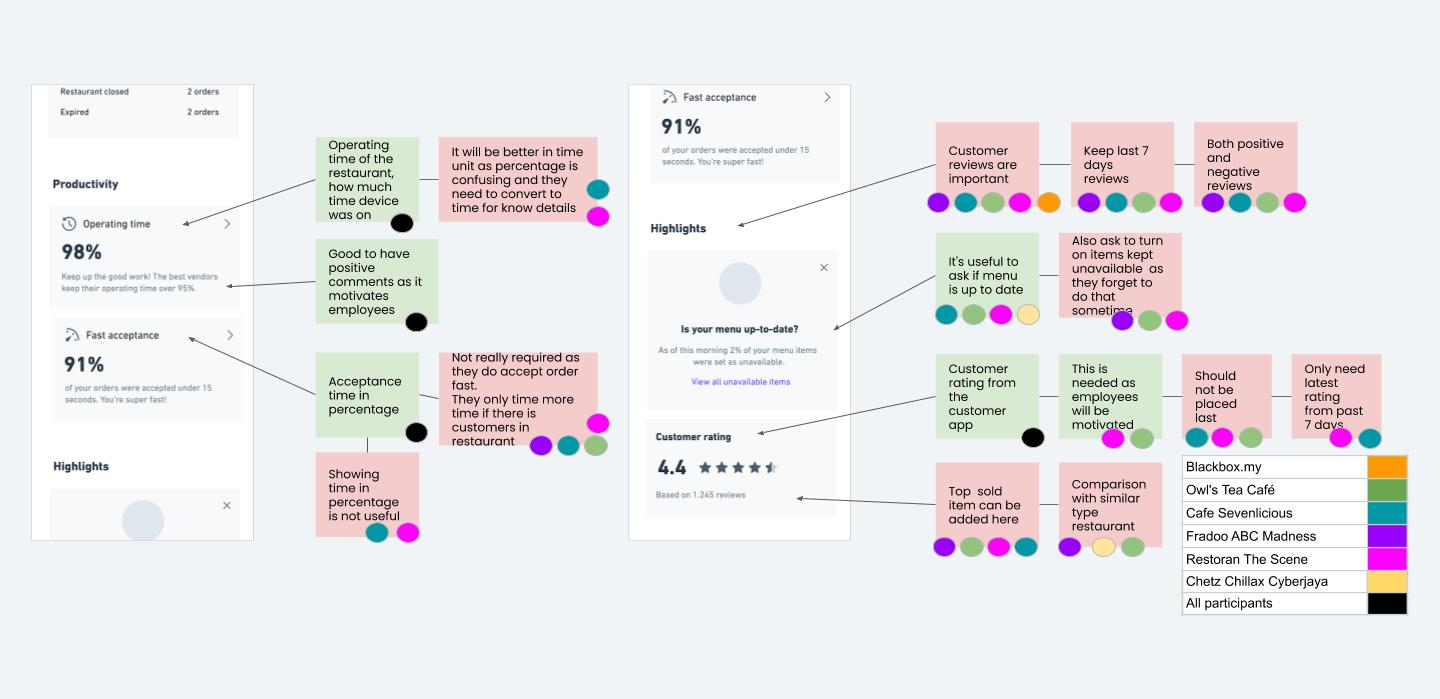
To get feedback, I shared the prototype with restaurants. I learned that customer reviews motivate them to improve their performance. Many stores regularly check reviews online or even have a physical customer comment box. I used this learning to highlight the information at the top of the screen and incentivize restaurants to regularly visit this page.

Analysis of feedback from restaurant interviews
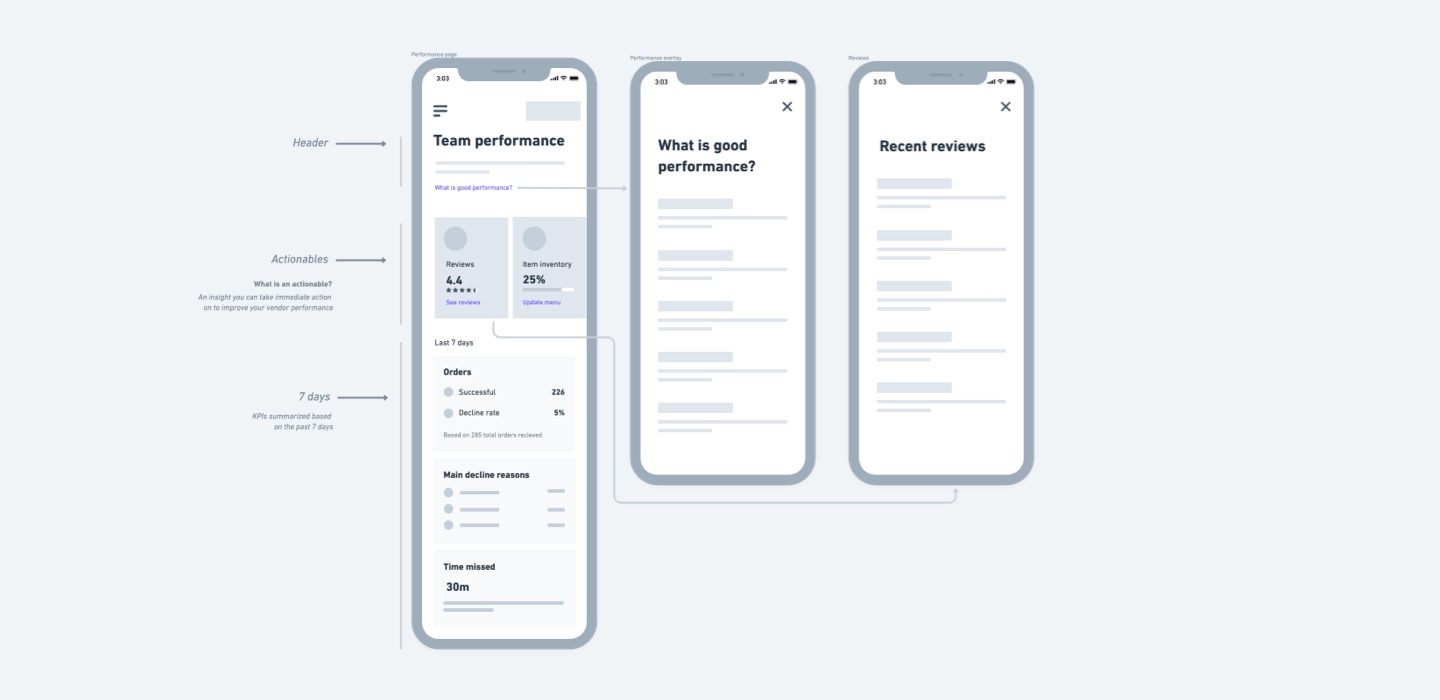
After implementing user feedback, I had a general idea ready and refined the prototype. Below was the final result of the low-fidelity designs after a couple of iterations:

Final result of low-fidelity designs
The final design
- Rating and reviews highlighted at the top of the screen
- Highlighted tasks users can take immediate action
- Performance goals presented as cards with summarized data from the past 7 days (ie. Successful orders, Decline rate)

Final design of Restaurant Performance Dashboard